

Abstract
Serum B12 assay is the most commonly used routine test for assessing cobalamin status in the body. In the United Kingdom, there are around 350 laboratories performing the assay using seven different platforms. External quality assessment of the assays is organised by UK NEQAS for Haematinics by sending a serum sample every 3 months. An 'all participants' consensus mean is calculated and used as the target value and the results analysed with respect to intra- and inter- group variation. The percentage bias from the target value is used to assess performance.
We present data on one such assessment to demonstrate the problems of the serum B12 assay (Survey number 248, April 2018) and also how it is interpreted by the laboratory for clinical use.
Method
A serum sample with a B12 target value of approximately 173 ng/L was sent to participating laboratories for analysis. Laboratories were also asked for an interpretation of their result which would be reported to the requesting clinician, namely from low to high.
Results
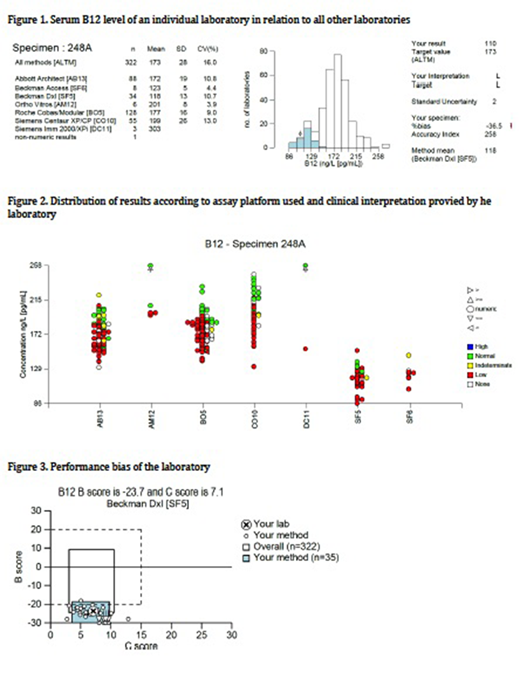
Fig 1 shows an individual laboratory's result (indicated by the arrow) in relation to all laboratories using the same technology (shaded histogram) or all methods (open histogram). There is a significant variation ranging from 86 to 258 ng/L depending on the assay used, with an overall standard deviation of 28 and co-efficient of variation of 16%.
Fig 2 shows the distribution of results in the different methodologies used and how each laboratory interpreted its result. It demonstrates the bias of results obtained by the different methods. The assays using Beckman Coulter Access/Dxl (SF5 and SF6) gave much lower results than other methods. In the group SF5, three laboratories interpreted the result as 'normal' and one as 'indeterminate'.
In the groups Abbot Architect (AB13) and Roche Cobas/Modular (BO5), although having higher results than other groups, there is a significant number of laboratories interpreting the result as 'low' and also 'normal' or 'indeterminate'.
Fig 3 shows a graphical representation of an individual laboratory's performance bias and the consistency of its individual and group bias over a period of 6 months. The Bias score (B score on y axis) is how far the result obtained deviated from the target value. The C score (on x axis) informs on consistency of the bias over the past 6 months. Hence, ideally both B score and C score should be as low as possible, and therefore all methodologies would harmonise towards similar results.
Discussion
These data demonstrate the limitations of the serum B12 assay in assessing body B12 status. The numerical value obtained of any sample can vary considerably between the different methodologies used. In addition, the interpretation provided by the laboratory can also be highly variable. This may have profound implications for clinical assessment and management. In addition, this is compounded by the fact that it is not quite clear what would be regarded as the normal or reference range. Laboratories in the United Kingdom use the manufacturers ranges and clinicians may consult the British Society for Haematology Guidelines (Devalia V et al (2014) BCSH Guidelines for the diagnosis and treatment of cobalamin and folate disorders. British Journal of Haematology, 166, 496-513) for help in clinical interpretation. Our data shows that the different reference ranges quoted by the kit manufacturers do not correspond to their assay bias, ie there is no simple direct correlation between the ranges provided against the bias of their particular assay.
Conclusion
The UK NEQAS Haematinics Programme demonstrates problems associated with the serum B12 assay with data on variation of results obtained, bias and interpretation of results in a style that is unique across currently available Proficiency Testing/ External Quality Assessment schemes.
Laboratories need to be aware of their performance in assessing serum B12 level in order to provide appropriate clinical advice. This needs collection of feedback and audit of data of the clinical situation for which the request was made.
Clinicians need to be aware of the performance of their laboratories in order that they can interpret the result provided in a meaningful way in relation to the clinical picture.
No relevant conflicts of interest to declare.

This feature is available to Subscribers Only
Sign In or Create an Account Close Modal